Infographics in Annual Report Design
Annual reports are vital to many businesses. They provide detailed information about the company, its investments, its purchases, and the path to its success throughout the year. Well-designed annual reports attract investors, encourage growth, and speak to shareholders. An annual report must meet a broad audience’s needs and expectations.
What are infographics?
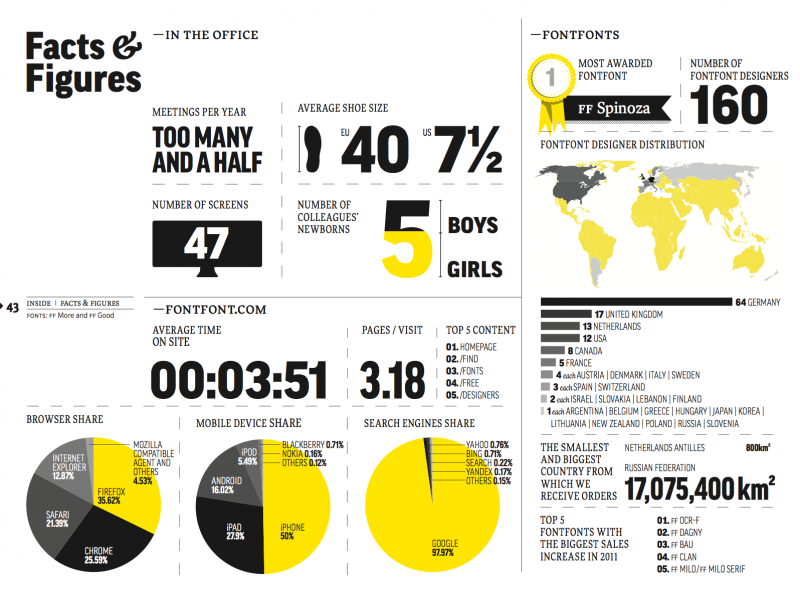
Infographics are a visual way to communicate complex information in a clear and concise way. They use a combination of text, graphics, and design elements to present information in a way that is easily understandable and memorable.
Infographics can take many different forms, including flowcharts, diagrams, maps, timelines, and more. They are often used in annual reports, marketing materials, and other documents where complex information needs to be conveyed in a way that is both engaging and informative.
Using bespoke can help your annual report speak to its broad audience and meet their varying needs. An infographic enables you to present often complex information in a clear and engaging format.
To meet these goals, your infographic needs to be well thought out. If it is too busy, messy, or doesn’t contain anything of use, then it will detract from the message of your annual report rather than adding to it.

Creative Harmony can assist you in creating the ideal infographic. Our professional design team are experienced in creating infographics for various business sectors.
While every infographic is different, meeting the specific needs of the business and the annual report, we follow some basic guidelines to ensure a perfect result.
A clever infographic design:
- Allows quick extraction of core information.
- Emphasises a key message or fact.
- Ensures format (look and feel) follows function.
- Is easy to understand.
Allows Quick Extraction of Core Information
Most readers will skim through the annual report searching for the core information and the parts that are particularly interesting to them. Making it easier to find this information makes your annual report more time efficient for the reader and makes them more likely to engage with a more significant amount of the report.
Emphasise a Key Message or Fact
While more in-depth reading is likely needed to understand the message fully, the takeaway should be clear and instant. Your key message should be immediately evident. If it isn’t, then your infographic design will be detrimental to your annual report. Including too many messages or facts is one mistake that infographic users often make. The core ideas get lost, and the infographic loses its impact.
Ensure Format follows Function
When designing infographics, creativity is vital. However, the creative design must never override the information or core message. An infographic that looks good but says nothing serves no purpose and should be removed from your annual report. If your infographic is nothing more than a pretty picture, it becomes a visual distraction that risks creating confusion and distrust in your reader.
Is Easy to Understand
Communicating information clearly and simply is the primary purpose of an infographic in an annual report. It should lay out clearly the key points in a way the written copy can’t and make them more accessible. If you attempt to make a single infographic convey multiple meanings to various audiences, it will most likely become disordered and confusing. Keep your annual report infographic simple. Use icons or other visual devices to help readers see and relate to the core facts. Don’t add unnecessary graphics that water down and confuse the information.
Creative Harmony – Your Annual Report Design Partner
Creative Harmony is the ideal partner to help create your successful annual report, including creating creative and clever infographics that will speak to your audience. Contact the team today to discuss your next annual report. Click on the link below or give us a call.
Not Just for Annual Reports
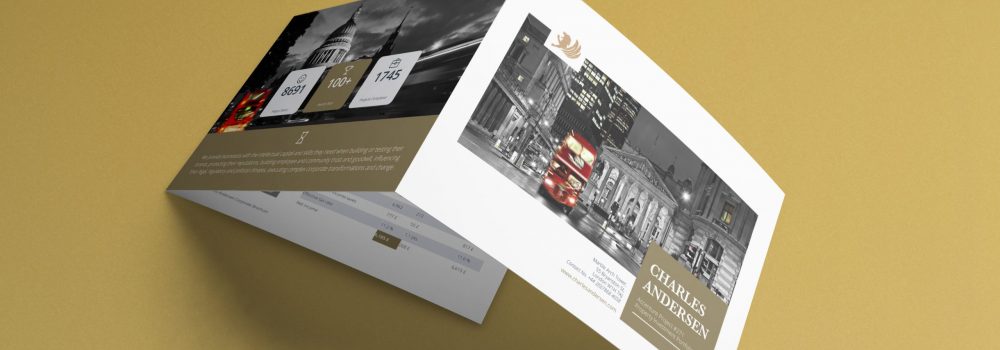
Infographics can add another dimension to any pamphlet, flyer or brochure. Using a bold, colourful infographic in your brochure catches the eye as your potential client flicks through. It gives them something to think about and return to at a later time.
Not sure how to incorporate an infographic into your brochure or flyer? Let us help. Our design team can create the ideal infographic for your needs. They will start by getting to know your business and our marketing goals and then produce an infographic that meets those goals.
Get in touch for a chat or a no-obligation quote.
Can we help you with your next project?
Creative Harmony is a full-service design agency. We assist clients with everything from business cards and interactive brochure design to state-of-the-art websites and brand guidelines. For a no-obligation quote on your next project, complete the contact form or give us a call.

